
- Studio (Visual Debugging): Real-time visualization and interactive debugging through a Web UI
- OpenTelemetry Tracing: Export trace data to external observability platforms (e.g., Langfuse, Jaeger) via the OTLP protocol
Studio (Visual Debugging)
Studio provides a Web interface for real-time visualization of Agent execution processes, supporting interactive debugging and message tracing.Core Features
- Real-time Visualization: Web interface displays Agent reasoning and execution processes
- Interactive Input: Interact with Agent through Web UI
- Message Tracing: View complete message flow and Trace
- Multi-Run Management: Support organization and comparison of multiple experimental runs
Quick Start
1. Start Studio Server
Start from source code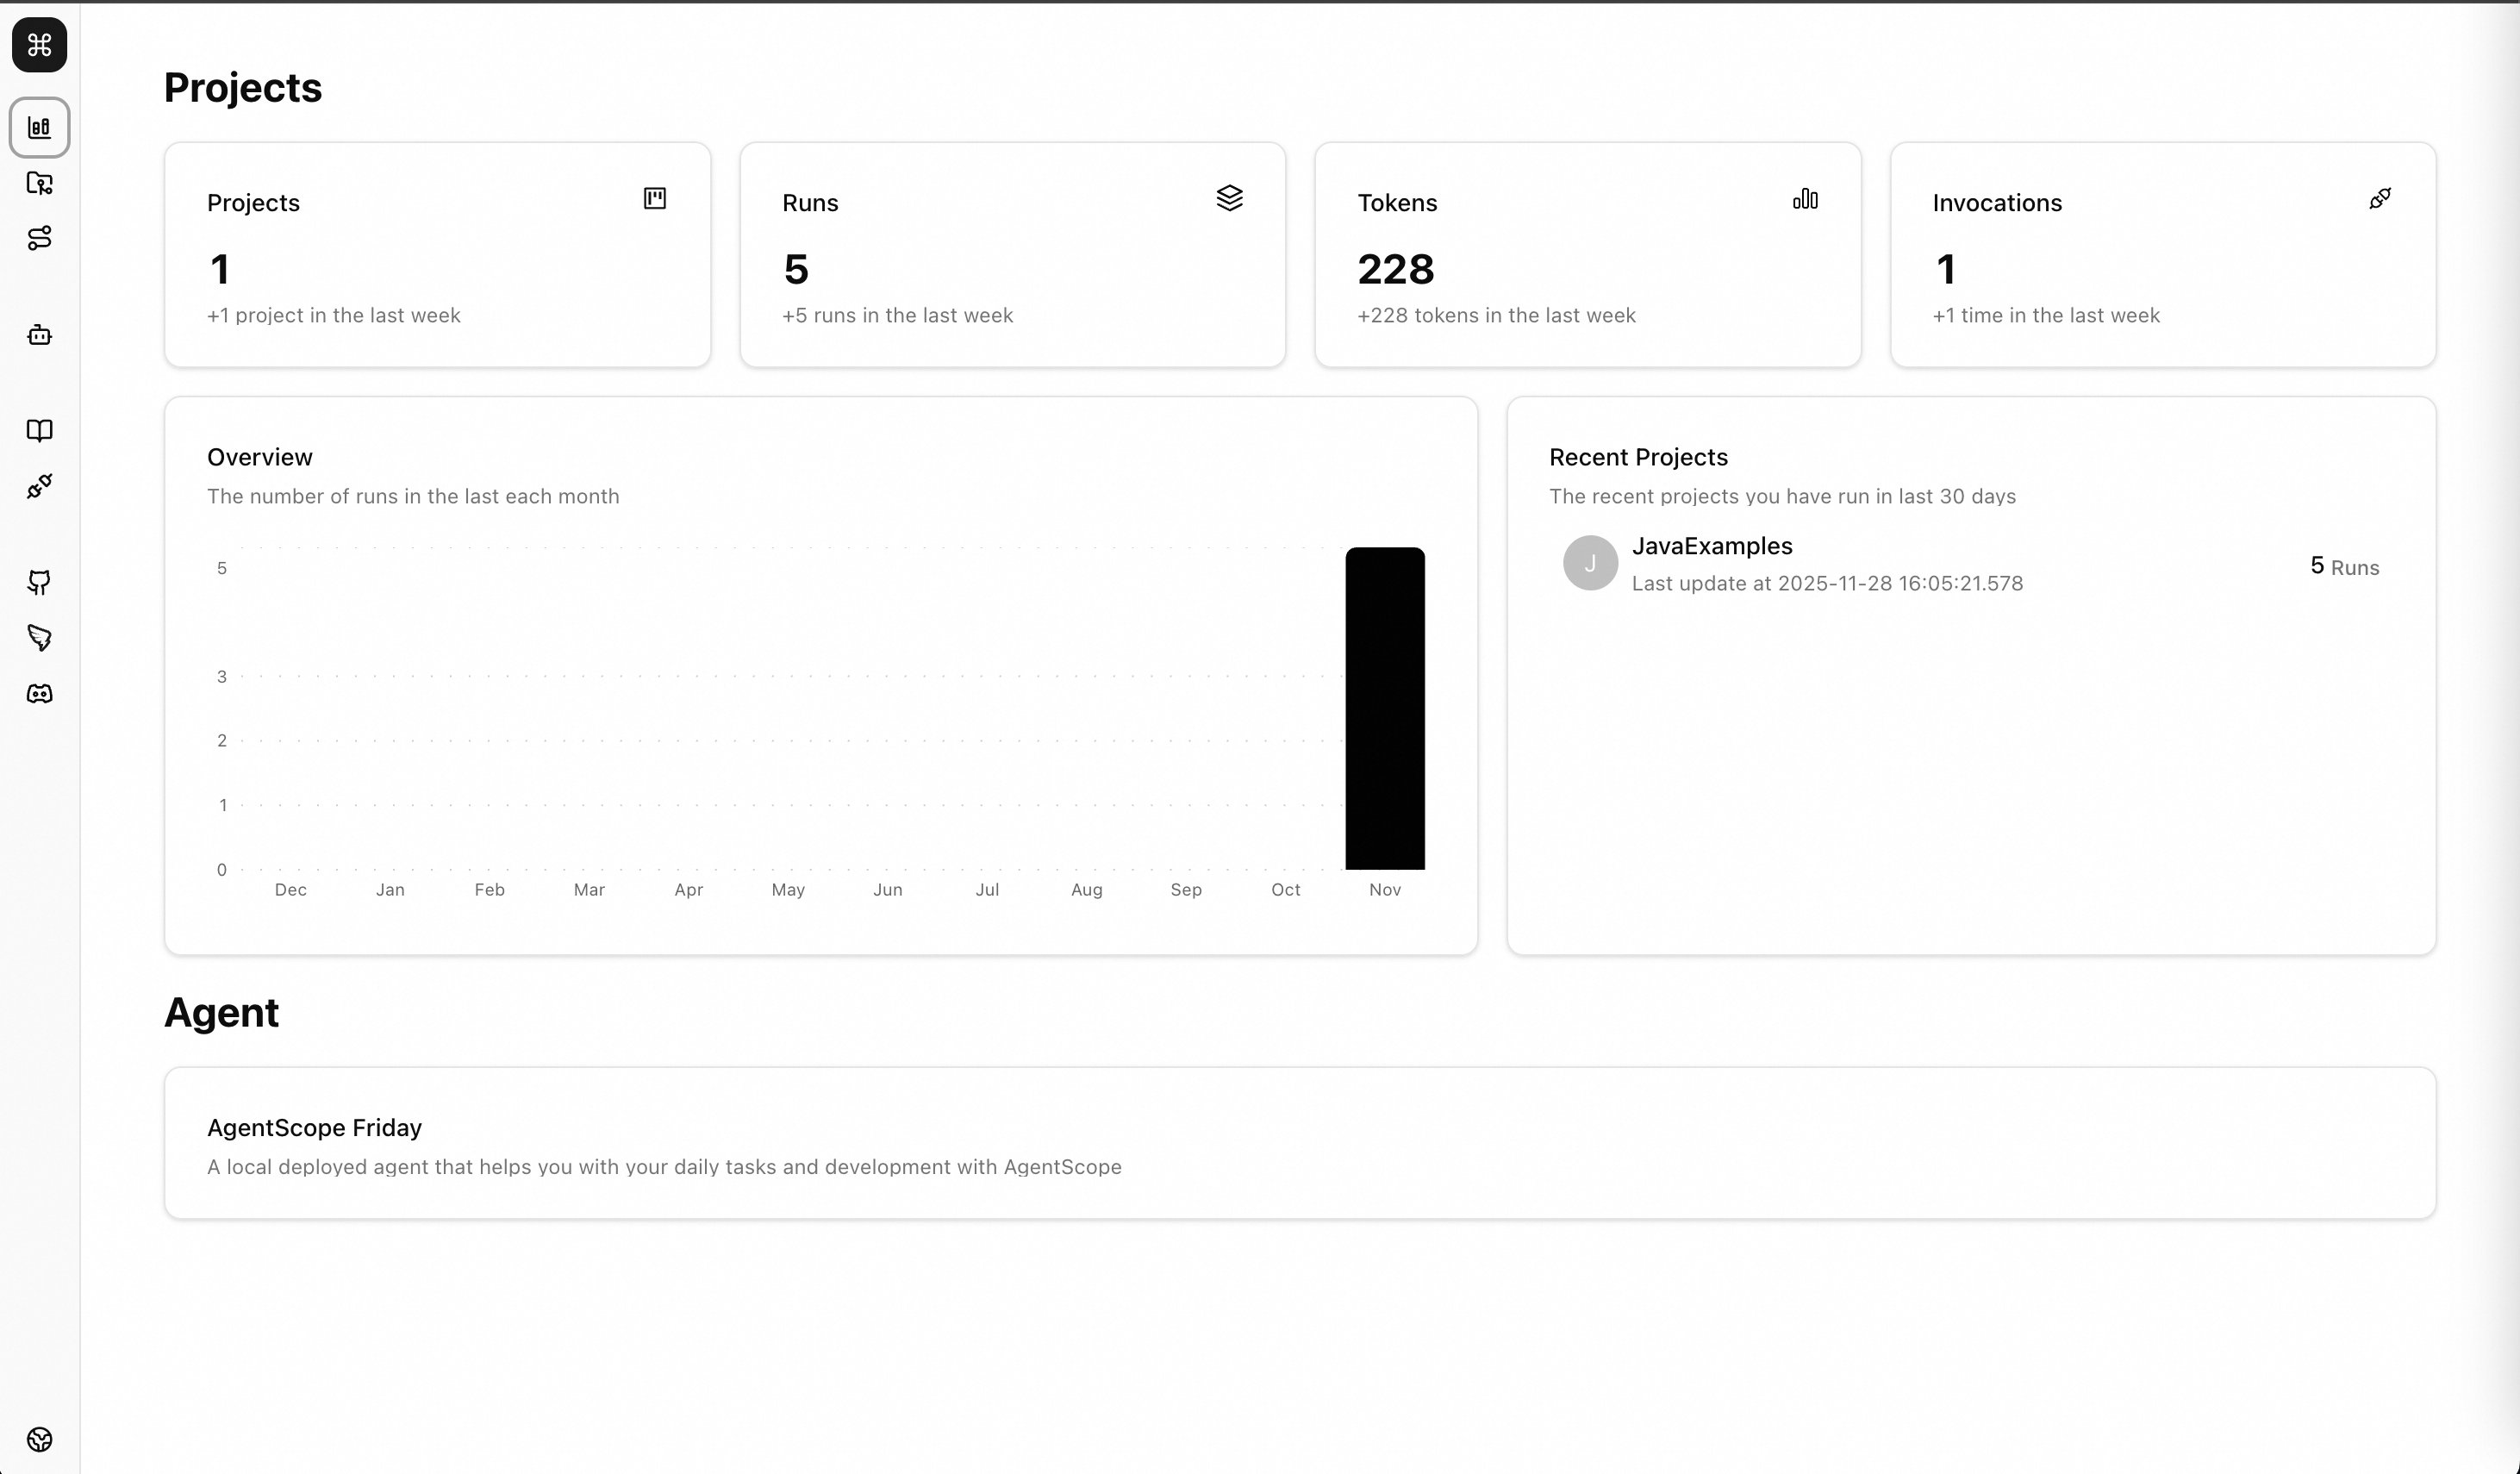
2. Java Application Integration
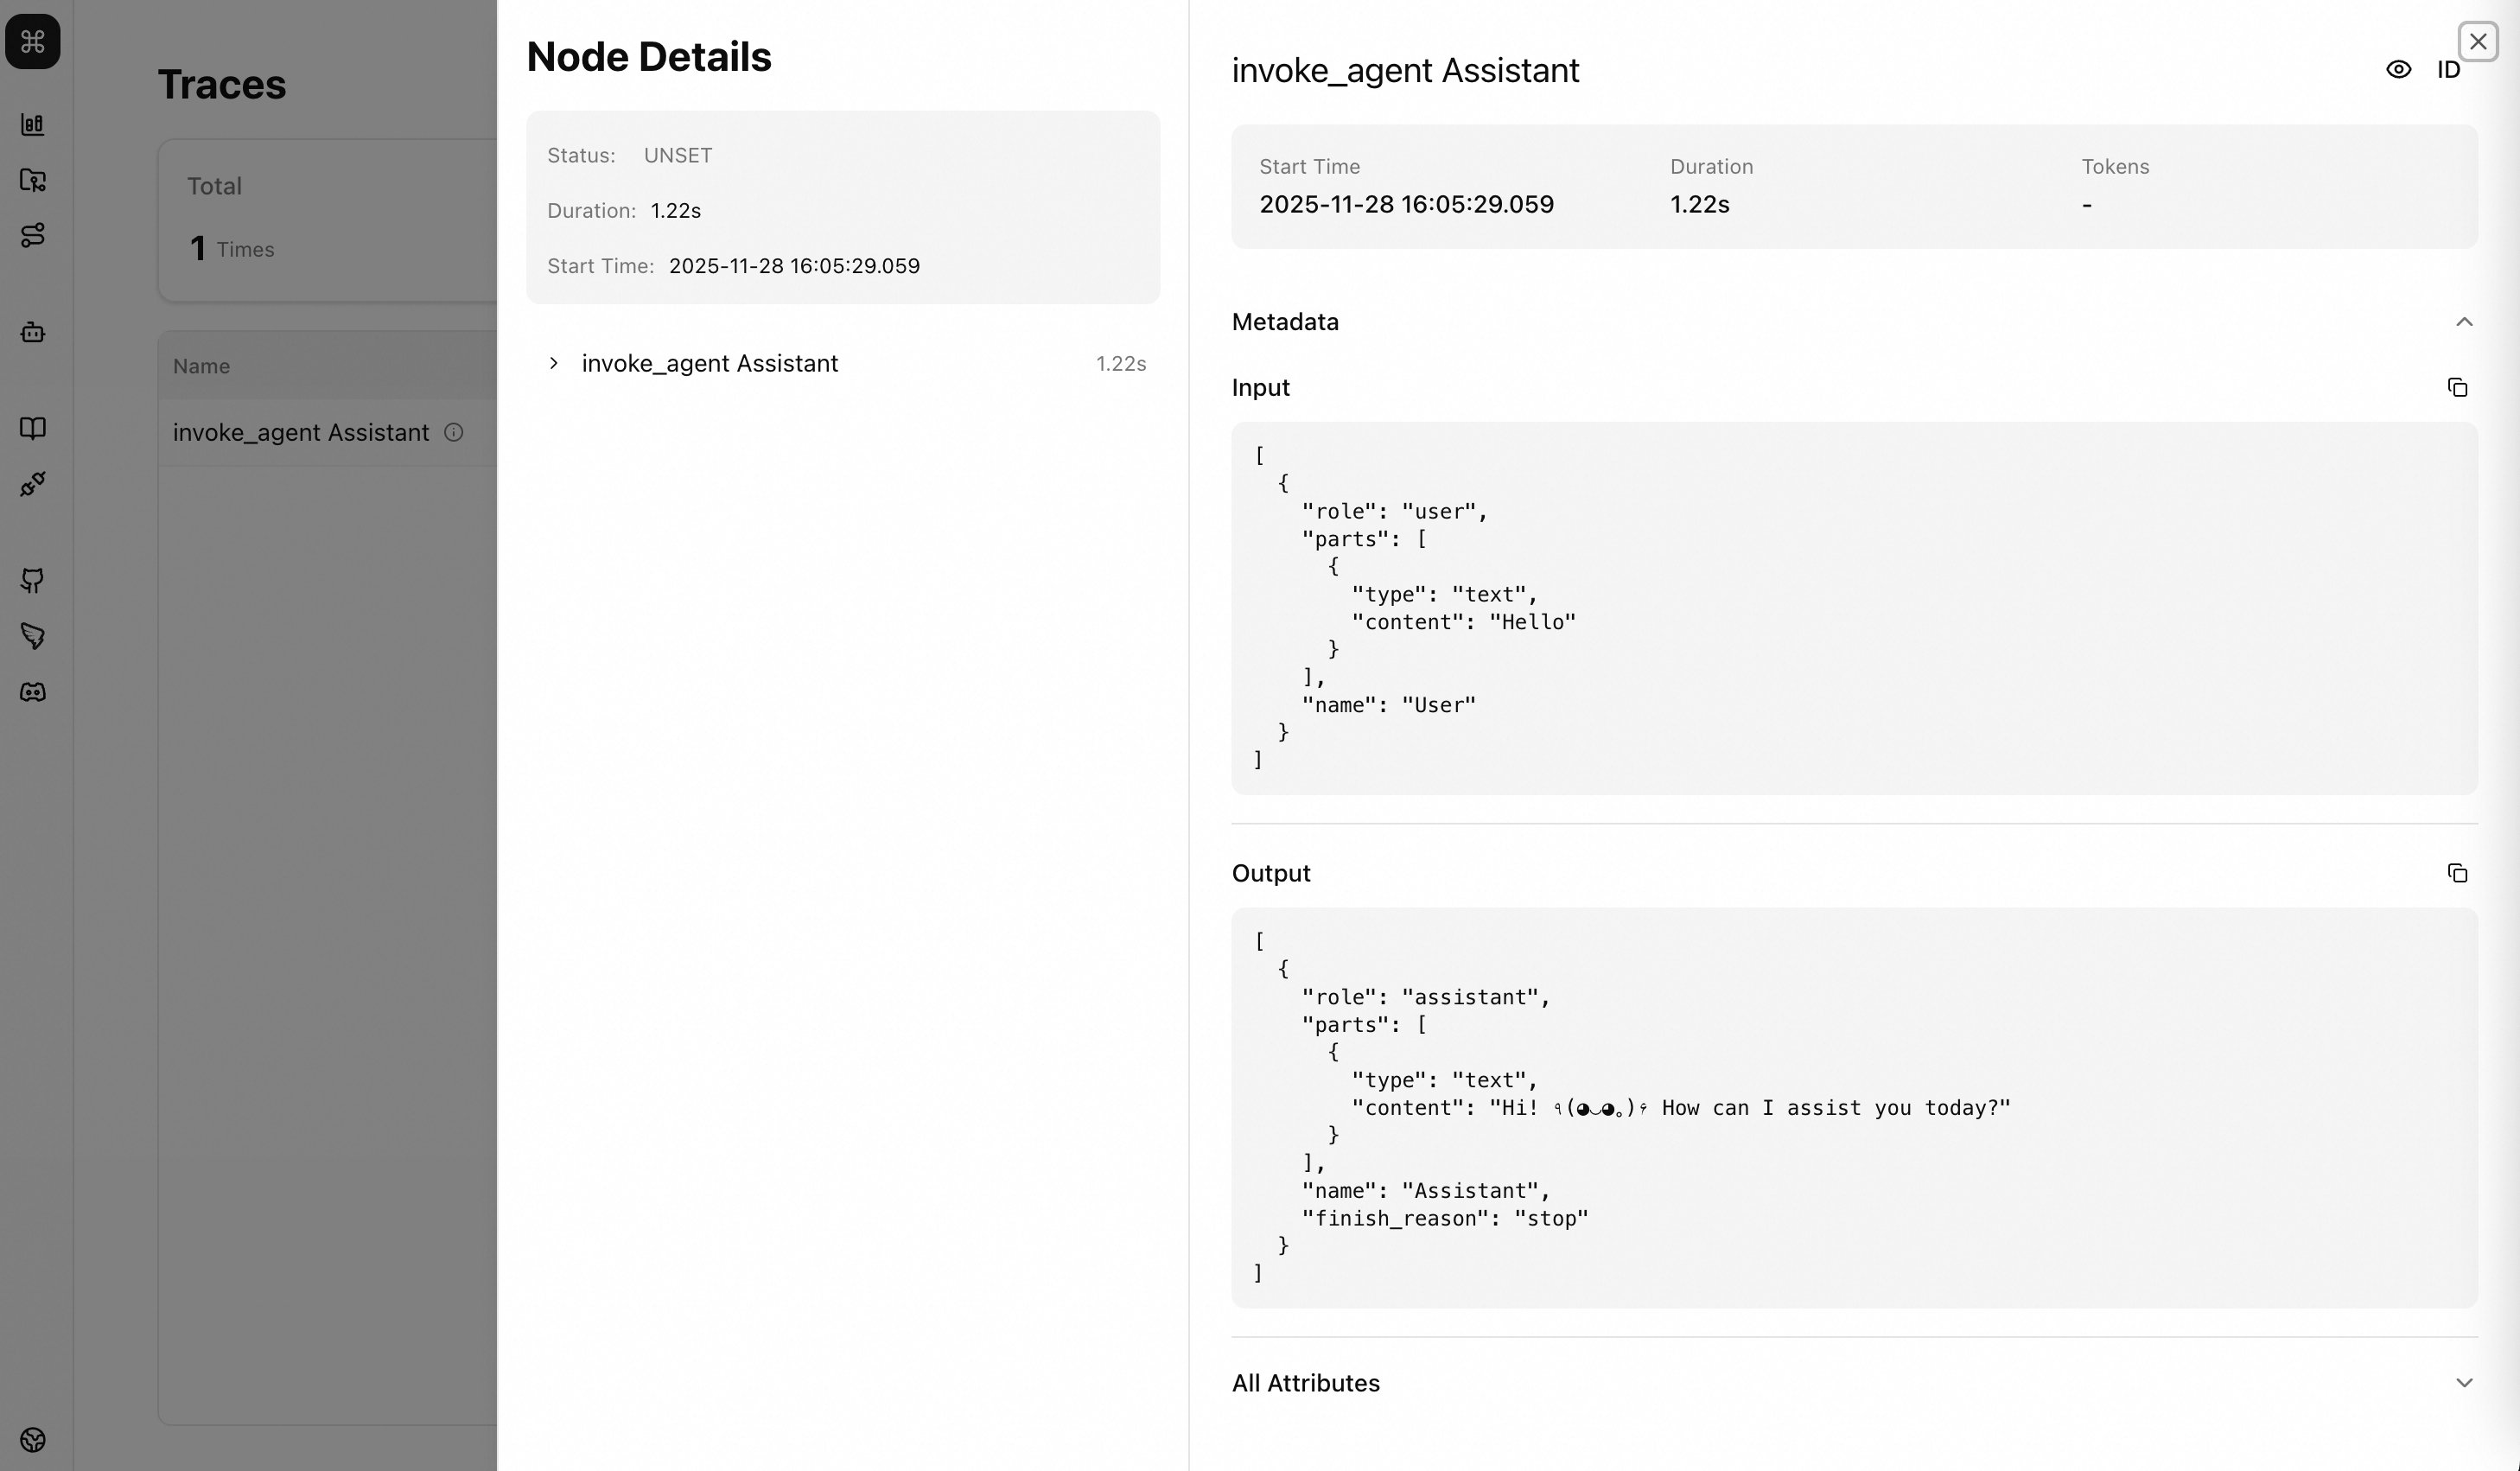
3. View Trace Information in AgentScope Studio
StudioUserAgent
Receive user input through Web UI.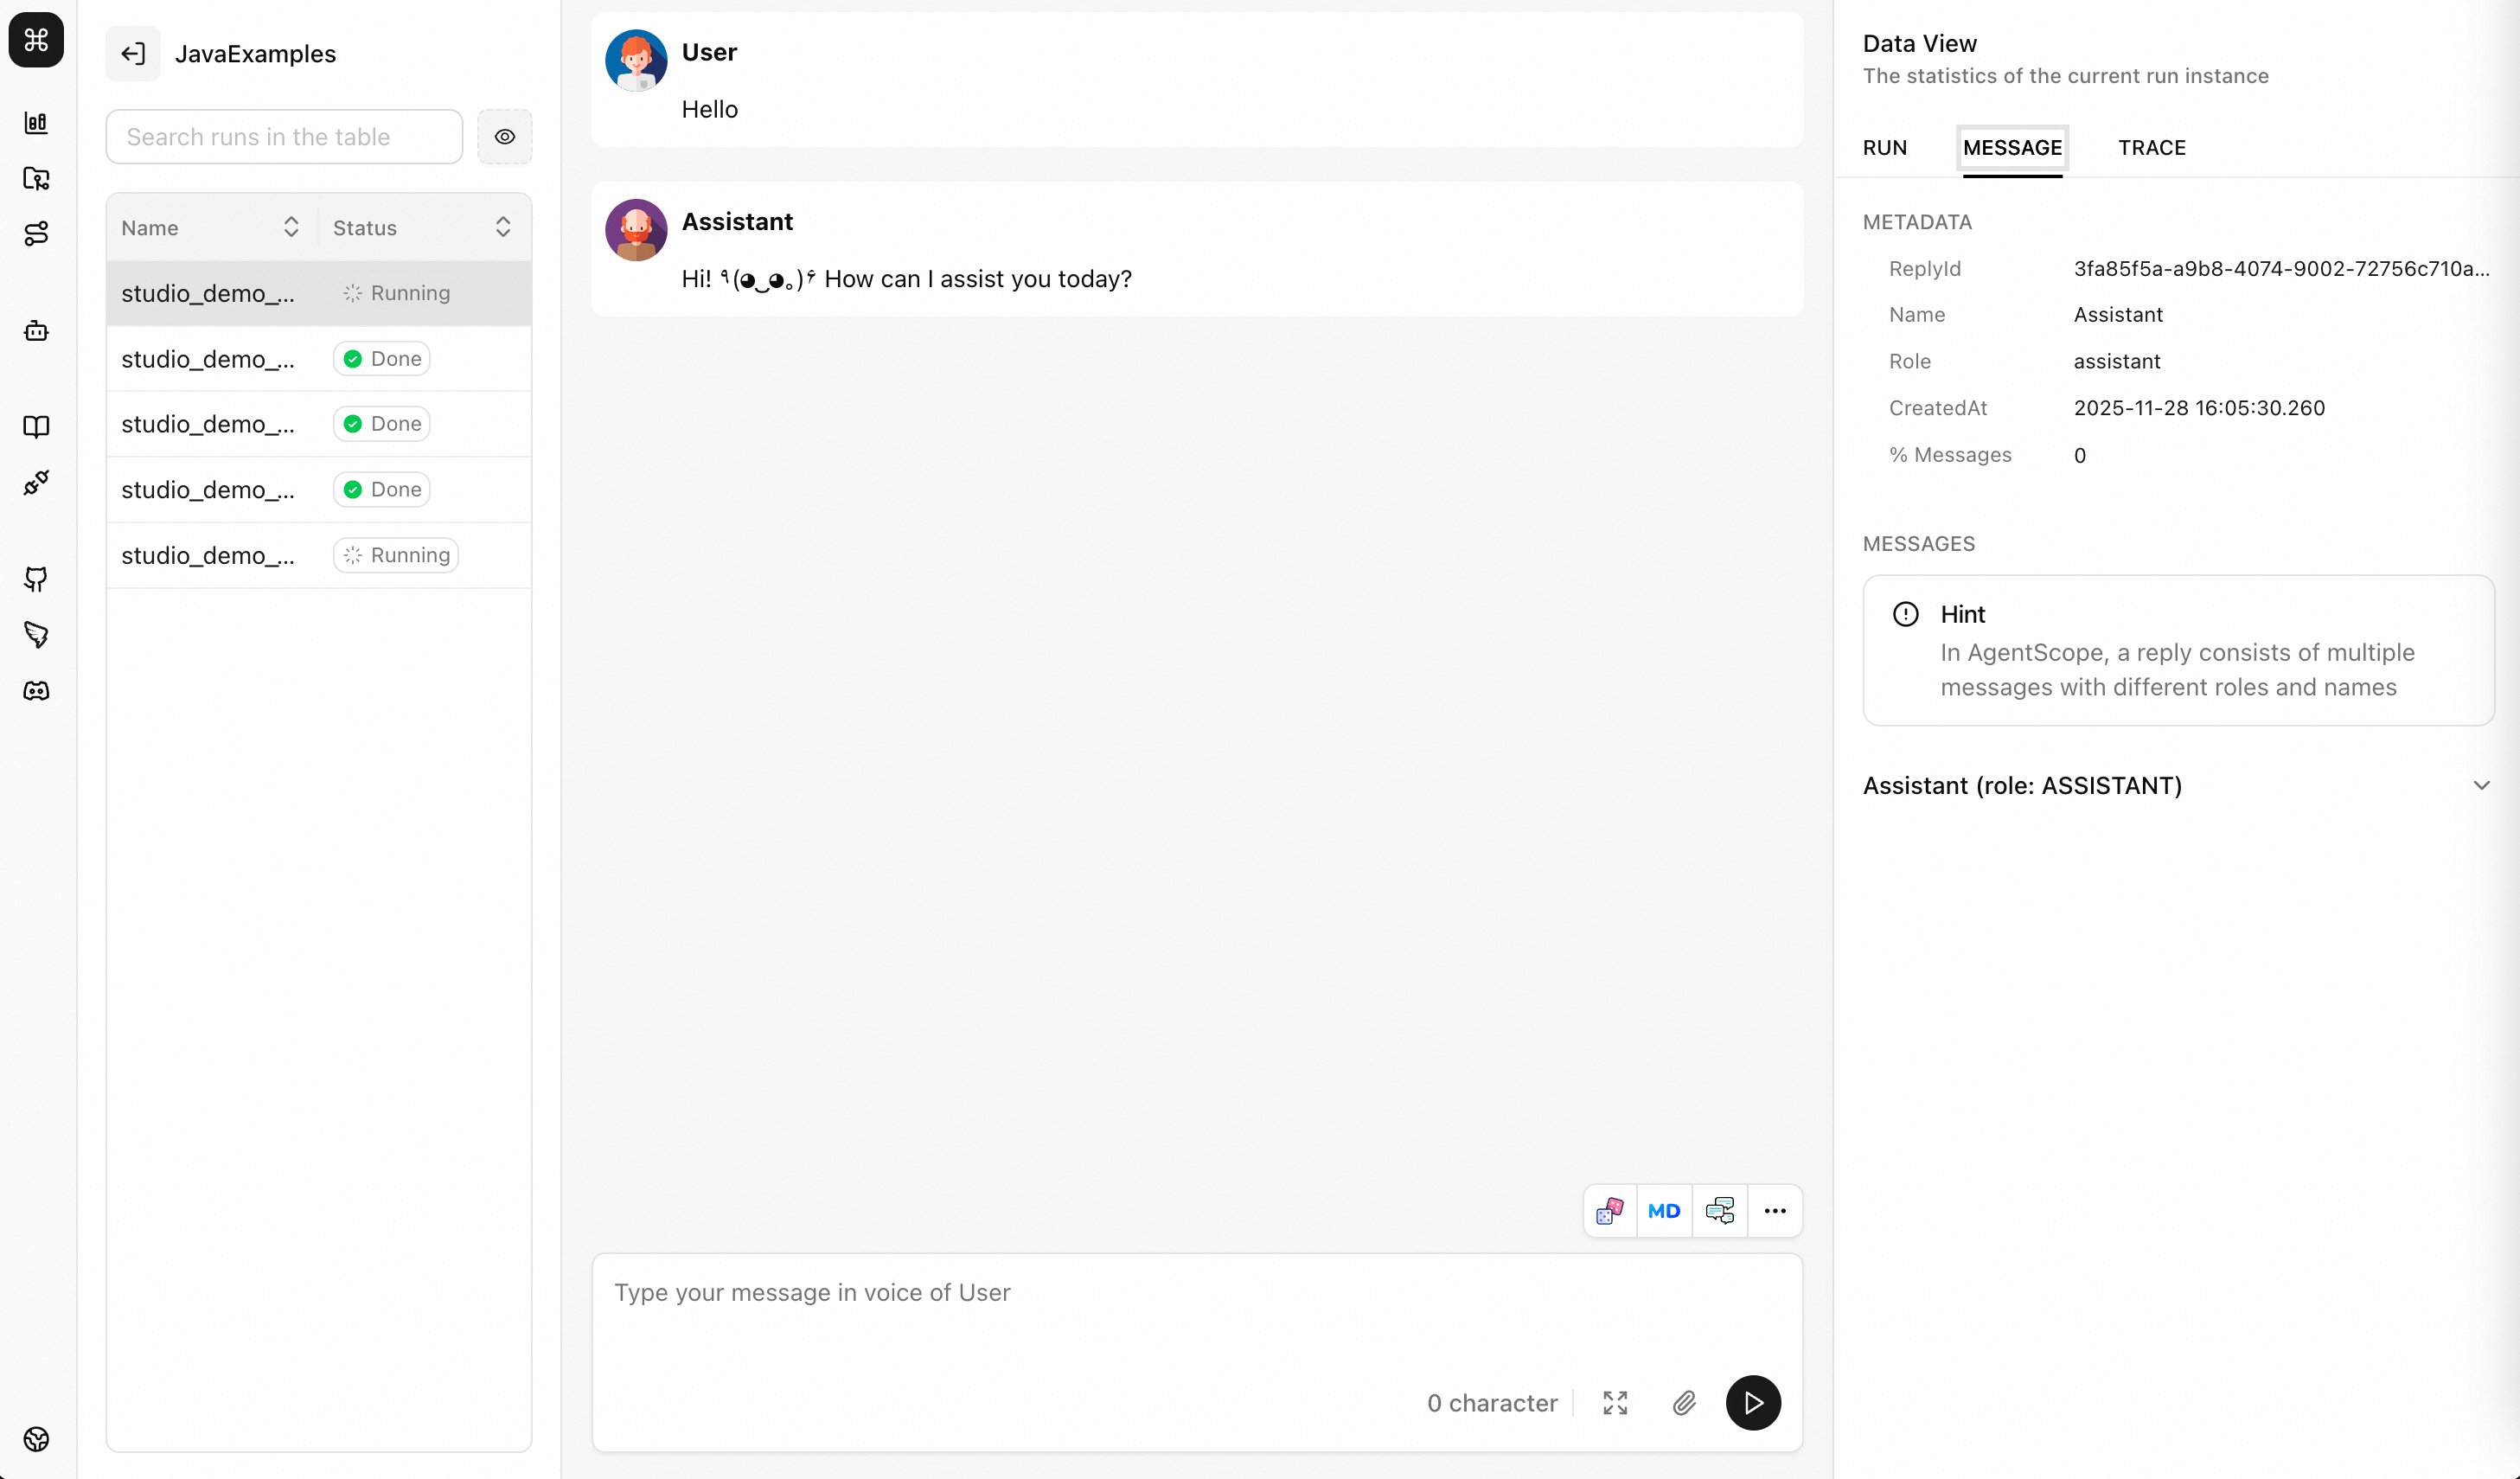
Conversation Loop
Complete Example
Advanced Usage
Manual Message Pushing
Multi-Agent Visualization
OpenTelemetry Tracing
AgentScope Java integrates with OpenTelemetry to provide distributed tracing for agent execution. You can export traces to any platform that supports the OTLP protocol, such as Langfuse.Quick Start
UseTelemetryTracer and register it via TracerRegistry to enable automatic tracing for all agent calls, model calls, and tool executions:
- Agent calls — span for each
agent.call() - Model calls — span for each LLM invocation
- Tool executions — span for each tool call
- Formatting — span for message formatting
Configuration
TelemetryTracer supports the following builder options:
Integration with Langfuse
Langfuse is an open-source observability platform that supports the OpenTelemetry protocol. You can send traces to Langfuse Cloud or a self-hosted instance.
Note: The x-langfuse-ingestion-version header is required by Langfuse when using the OTLP endpoint. Make sure to include it.
After running your agent, you can view the traces in the Langfuse dashboard, including the full call chain, latency, and input/output of each step.
Integration with Other OTLP Backends
Any platform that supports the OTLP protocol can be used. For example, to send traces to a local Jaeger instance:More Resources
- Studio Example: StudioExample.java
- Studio Repository: https://github.com/agentscope-ai/agentscope-studio
- Hook Documentation: hook.md